トレバー・バウアー(Trevor Bauer) の研究②

2019-2021 バウアーを調べる
==その2==
データ準備
!pip install pybaseball
from pybaseball import statcast
import pandas as pd
from pybaseball import statcast

dates = [
    '2021-04-02', '2021-04-07', '2021-04-13', '2021-04-18', '2021-04-24', '2021-04-29',
    '2021-05-04', '2021-05-09', '2021-05-15', '2021-05-21', '2021-05-26', '2021-05-31',
    '2021-06-06', '2021-06-12', '2021-06-18', '2021-06-23', '2021-06-28', '2020-07-26',
    '2020-08-02', '2020-08-07', '2020-08-19', '2020-08-24', '2020-08-29', '2020-09-04',
    '2020-09-09', '2020-09-14', '2020-09-19', '2020-09-23', '2019-03-30', '2019-04-04',
    '2019-04-10', '2019-04-15', '2019-04-20', '2019-04-25', '2019-04-30', '2019-05-06',
    '2019-05-11', '2019-05-16', '2019-05-21', '2019-05-26', '2019-05-31', '2019-06-06',
    '2019-06-11', '2019-06-16', '2019-06-21', '2019-06-26', '2019-07-02', '2019-07-07',
    '2019-07-13', '2019-07-18', '2019-07-23', '2019-07-28', '2019-08-03', '2019-08-09',
    '2019-08-14', '2019-08-19', '2019-08-25', '2019-08-31', '2019-09-04', '2019-09-10',
    '2019-09-15', '2019-09-22'
]

# Create an empty DataFrame to store the data
df_545333_all_dates = pd.DataFrame()

# Fetch data for each date and concatenate
for date in dates:
    df_single_day = statcast(start_dt=date, end_dt=date)
    df_545333_single_day = df_single_day[df_single_day['pitcher'] == 545333]
    df_545333_all_dates = pd.concat([df_545333_all_dates, df_545333_single_day])

# Reset the index of the final DataFrame
df_545333_all_dates.reset_index(drop=True, inplace=True)
球種
# 投球結果を抽出
df_545333 = df_545333_all_dates

# df_545333のpitch_typeカラムに含まれるユニークな球種を確認する
unique_pitch_types = df_545333['pitch_type'].unique()

# 確認した球種を表示する
print(unique_pitch_types)
結果、
['FC' 'FF' 'ST' 'KC' 'CH' 'SI' nan]
- FC : カットファストボール(Cutter)
- FF : フォーシームファストボール(Four-seam Fastball)
- ST : スライダー or スイーパー
- KC : ナックルカーブ(Knuckle Curve)
- CH : チェンジアップ(Changeup)
- SI : ツーシームファストボール(Two-seam Fastball)or シンカー(Sinker)
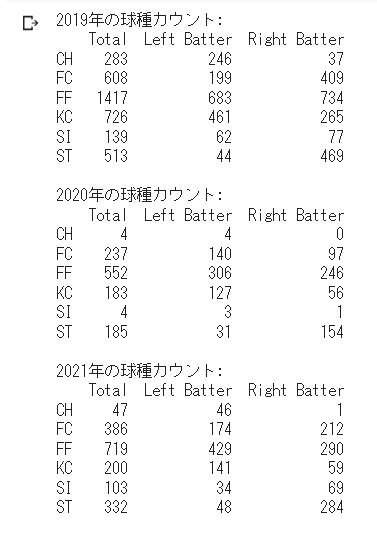
球種カウント (年ごと)
このコードは、バウアー選手の投球データを左打者と右打者に分けて球種別の出現回数をカウントし、2019年、2020年、2021年の各年度ごとに表示します。
import pandas as pd

def pitch_counts(df):
    # 左打者と右打者に対する投球データを抽出
    df_L = df[df['stand'] == 'L']
    df_R = df[df['stand'] == 'R']

    # 各カテゴリーでの球種の出現回数をカウント
    total_counts = df['pitch_type'].value_counts()
    left_counts = df_L['pitch_type'].value_counts()
    right_counts = df_R['pitch_type'].value_counts()

    # 出現回数をデータフレームにまとめる
    pitch_counts_table = pd.DataFrame({'Total': total_counts, 'Left Batter': left_counts, 'Right Batter': right_counts})

    # NaNを0に置き換える
    pitch_counts_table.fillna(0, inplace=True)

    # カウントを整数に変換する
    pitch_counts_table = pitch_counts_table.astype(int)

    return pitch_counts_table

# 続けて、球種カウントのコードを実行します。
# Split the data by year
df_2019 = df_545333_all_dates[df_545333_all_dates['game_year'] == 2019]
df_2020 = df_545333_all_dates[df_545333_all_dates['game_year'] == 2020]
df_2021 = df_545333_all_dates[df_545333_all_dates['game_year'] == 2021]

# Get pitch counts for each year
pitch_counts_2019 = pitch_counts(df_2019)
pitch_counts_2020 = pitch_counts(df_2020)
pitch_counts_2021 = pitch_counts(df_2021)

# Display the results
print("2019年の球種カウント:")
print(pitch_counts_2019)
print("\n2020年の球種カウント:")
print(pitch_counts_2020)
print("\n2021年の球種カウント:")
print(pitch_counts_2021)
空振り三振、見逃し三振 コース (年ごと)
このコードは、バウアー選手の2019年、2020年、2021年の各年度におけるストライクアウト(called_strikeとswinging_strike)の投球位置を、球種別に散布図で表示します。
import matplotlib.pyplot as plt
import pandas as pd

def plot_strikeout_location_by_year(df_2019, df_2020, df_2021):
    df_2019_strikeouts = df_2019[df_2019['events'] == 'strikeout']
    df_2020_strikeouts = df_2020[df_2020['events'] == 'strikeout']
    df_2021_strikeouts = df_2021[df_2021['events'] == 'strikeout']

    combined_df = pd.concat([df_2019_strikeouts, df_2020_strikeouts, df_2021_strikeouts])

    grouped = combined_df.groupby('pitch_type')

    nrows = 3
    ncols = 2

    titles = []

    fig, axes = plt.subplots(nrows=nrows, ncols=ncols, figsize=(10, 15))

    for idx, (pitch_type, data) in enumerate(grouped):
        titles.append(pitch_type)

        row = idx // ncols
        col = idx % ncols

        ax = axes[row][col]

        data_called_strikeouts = data[data['description'] == 'called_strike']
        data_swinging_strikeouts = data[data['description'] == 'swinging_strike']

        data_2019_called = data_called_strikeouts[data_called_strikeouts.index.isin(df_2019.index)]
        data_2020_called = data_called_strikeouts[data_called_strikeouts.index.isin(df_2020.index)]
        data_2021_called = data_called_strikeouts[data_called_strikeouts.index.isin(df_2021.index)]

        data_2019_swinging = data_swinging_strikeouts[data_swinging_strikeouts.index.isin(df_2019.index)]
        data_2020_swinging = data_swinging_strikeouts[data_swinging_strikeouts.index.isin(df_2020.index)]
        data_2021_swinging = data_swinging_strikeouts[data_swinging_strikeouts.index.isin(df_2021.index)]

        ax.scatter(data_2019_called['plate_x'], data_2019_called['plate_z'], label='2019 Called', color='blue', marker='o')
        ax.scatter(data_2020_called['plate_x'], data_2020_called['plate_z'], label='2020 Called', color='red', marker='o')
        ax.scatter(data_2021_called['plate_x'], data_2021_called['plate_z'], label='2021 Called', color='green', marker='o')

        ax.scatter(data_2019_swinging['plate_x'], data_2019_swinging['plate_z'], label='2019 Swinging', color='blue', marker='x')
        ax.scatter(data_2020_swinging['plate_x'], data_2020_swinging['plate_z'], label='2020 Swinging', color='red', marker='x')
        ax.scatter(data_2021_swinging['plate_x'], data_2021_swinging['plate_z'], label='2021 Swinging', color='green', marker='x')

        x = [-0.88, 0.88, 0.88, -0.88, -0.88]
        y = [1.51, 1.51, 3.4, 3.4, 1.51]
        ax.fill(x, y, color='r', alpha=0.3)


# Set X and Y axis limits
        ax.set_xlim(-3, 3)
        ax.set_ylim(0, 5)

        ax.set_title(pitch_type)
        ax.set_xlabel('Plate X')
        ax.set_ylabel('Plate Z')

        ax.grid(which='both', linestyle='--', color='gray', alpha=0.5)

        ax.legend()

    plt.tight_layout()
    plt.show()

# 各球種ごとにグラフを分けて、2019年、2020年、2021年のデータを色分けしてプロット
plot_strikeout_location_by_year(df_2019, df_2020, df_2021)
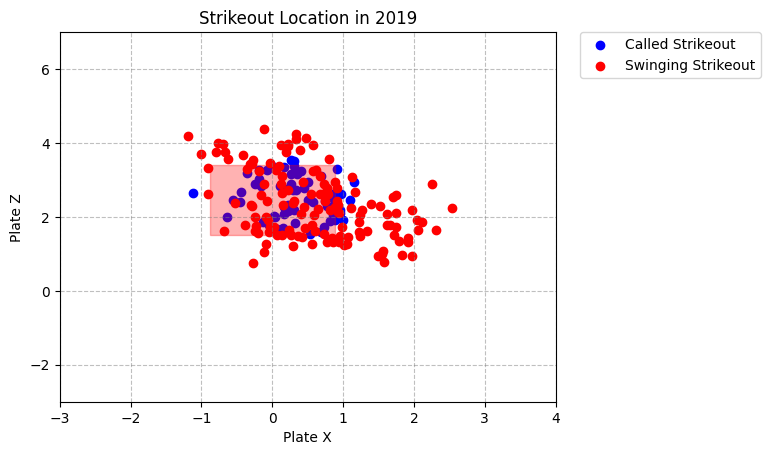
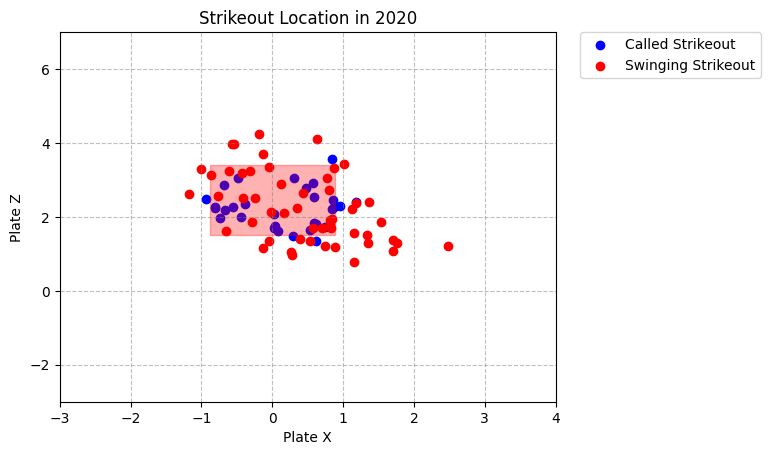
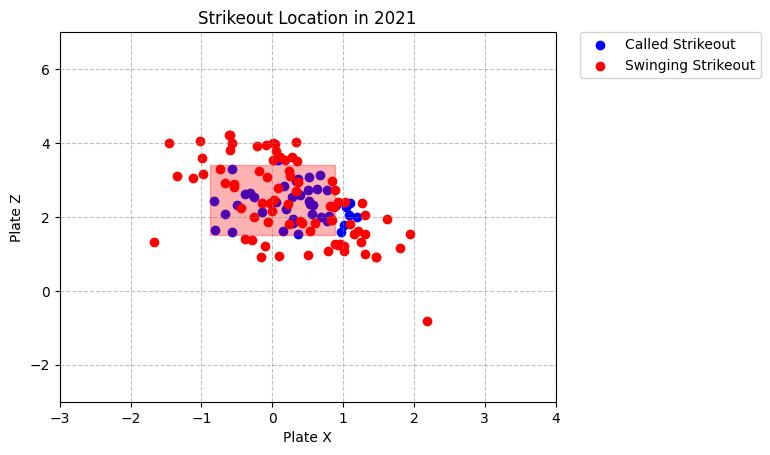
空振り三振、見逃し三振 コース (球種別)
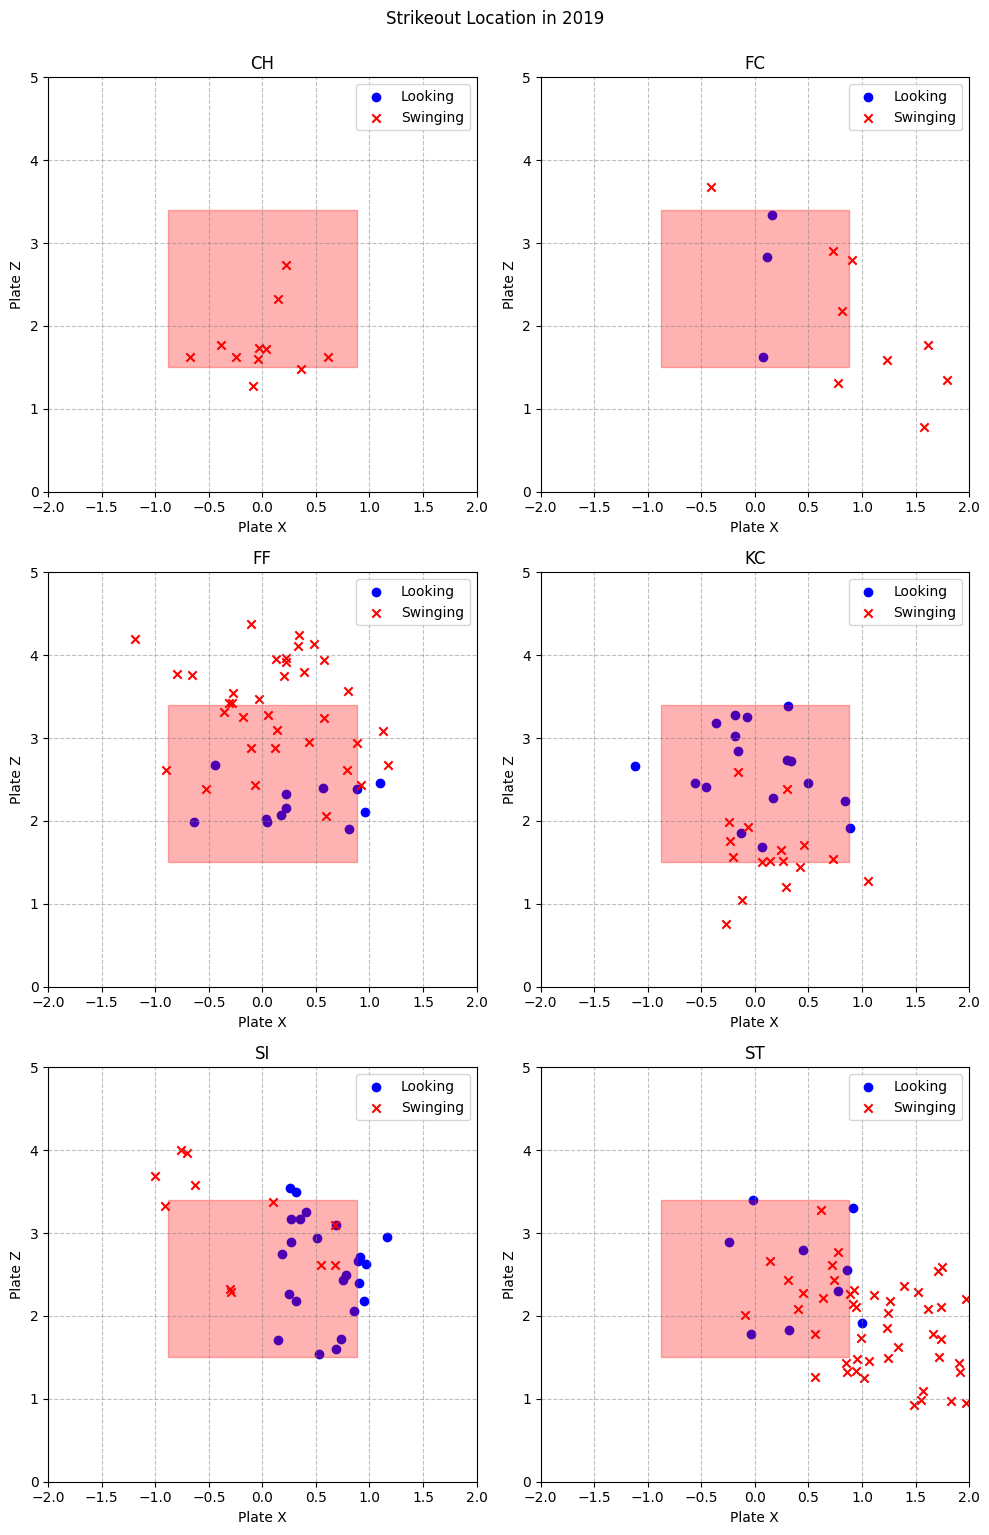
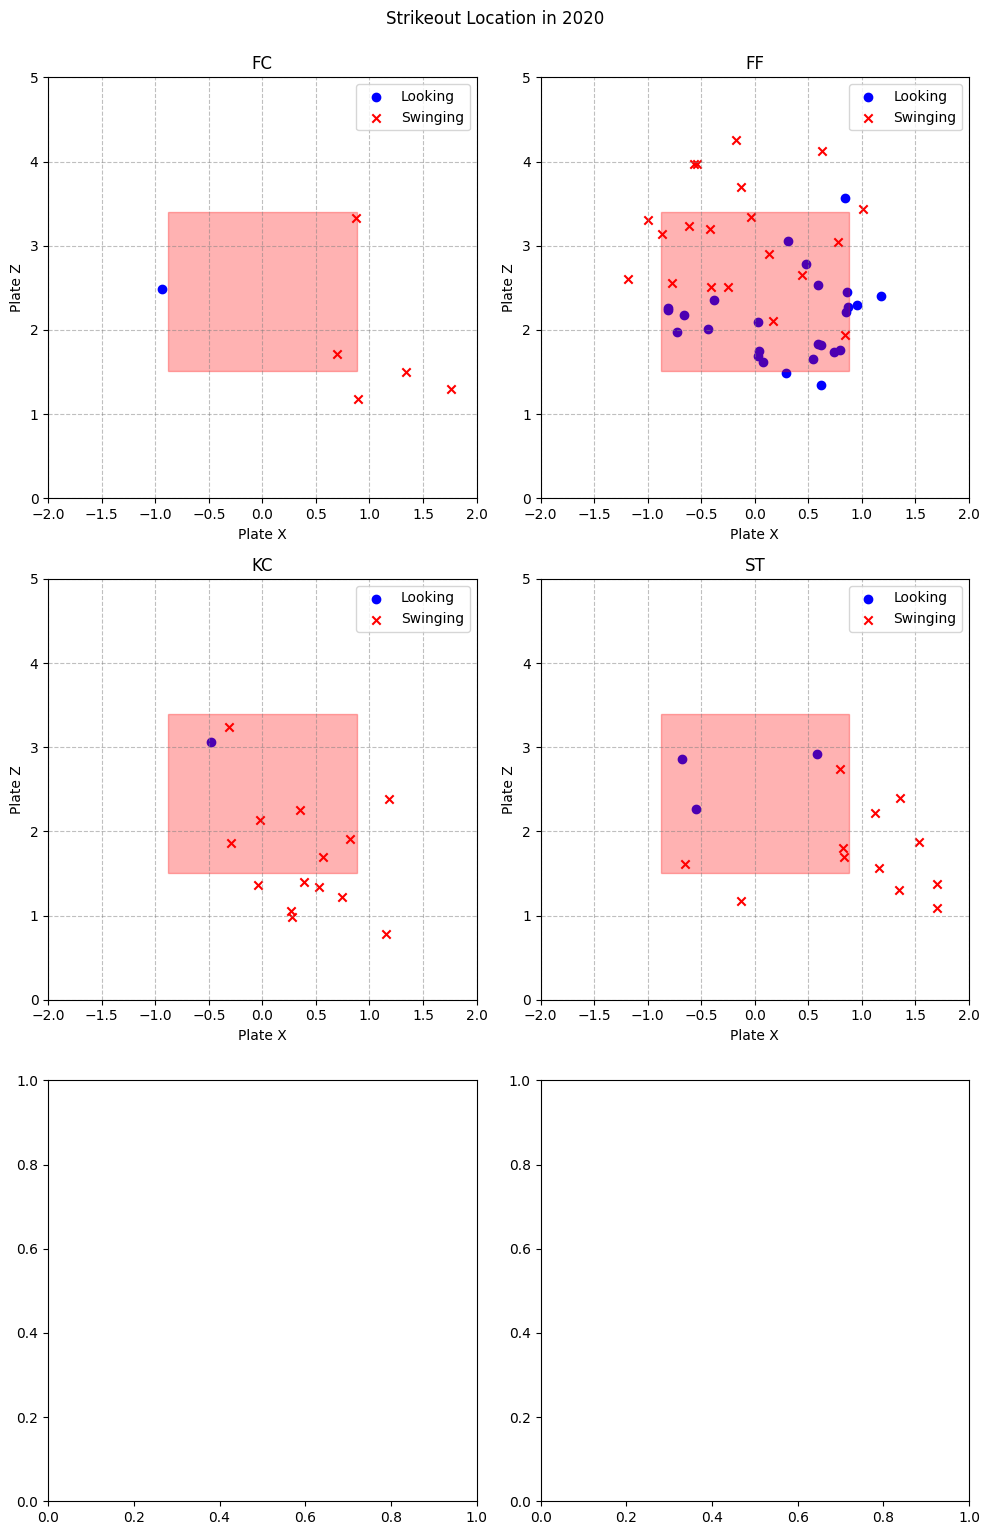
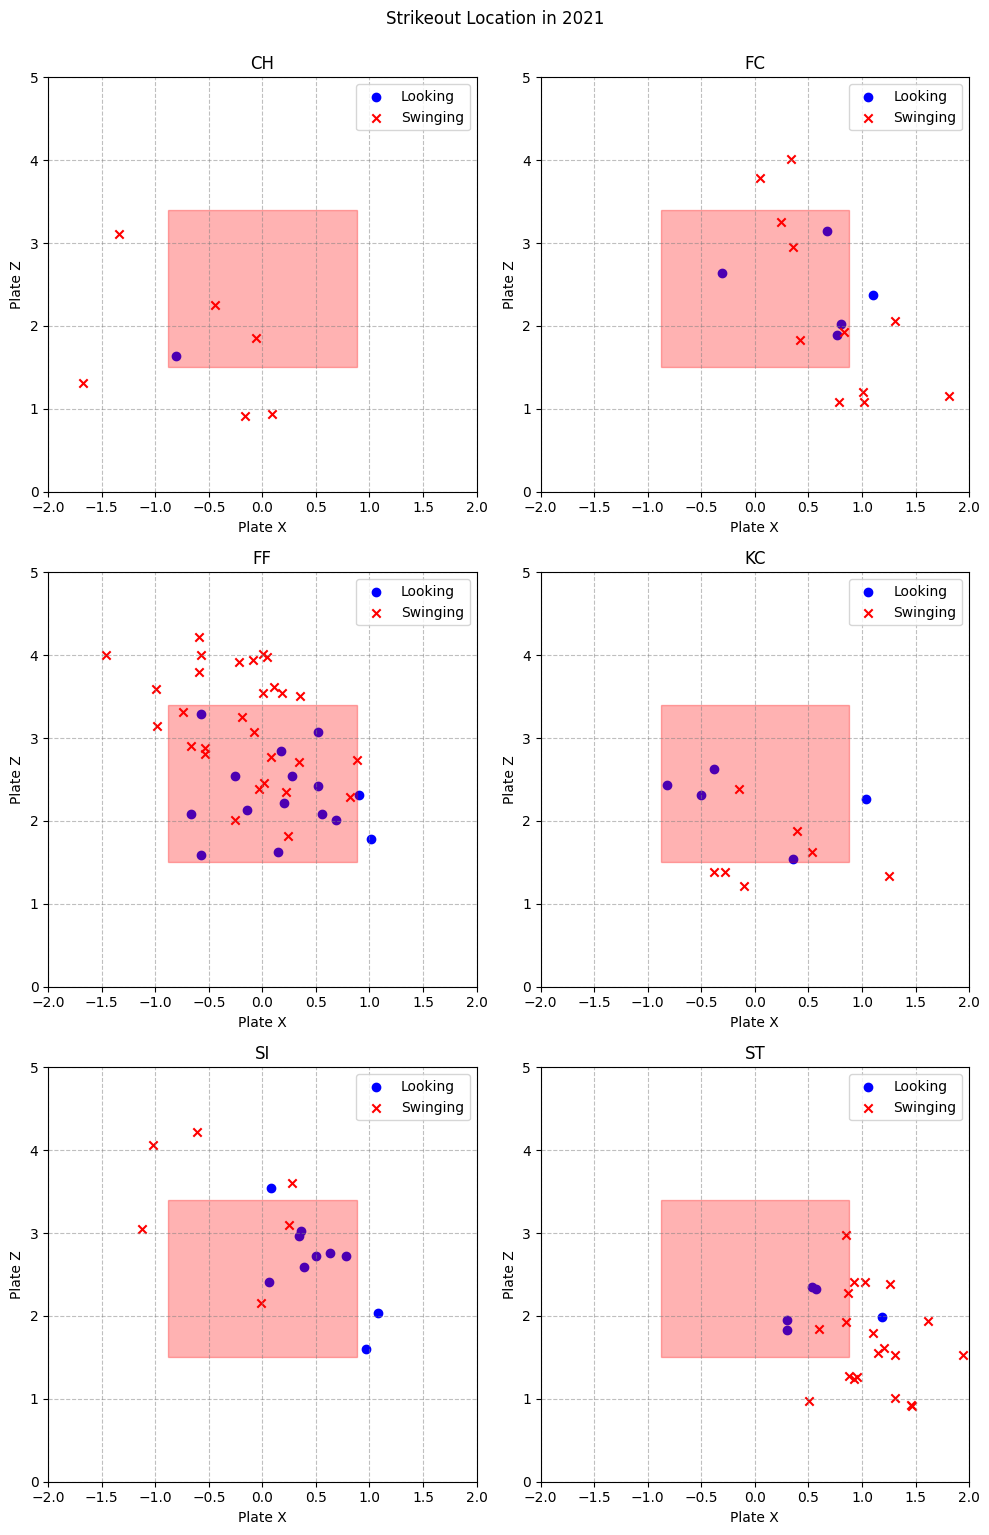
このコードは、バウアー選手の各年度(2019年、2020年、2021年)におけるストライクアウト(called_strikeとswinging_strike)の投球位置を、球種別に散布図で表示します。各年度ごとに個別のグラフが表示されます。
def plot_strikeout_location_single_year(df, year):
    df_strikeouts = df[df['events'] == 'strikeout']
    grouped = df_strikeouts.groupby('pitch_type')

    nrows = 3
    ncols = 2
    titles = []

    fig, axes = plt.subplots(nrows=nrows, ncols=ncols, figsize=(10, 15))

    for idx, (pitch_type, data) in enumerate(grouped):
        titles.append(pitch_type)

        row = idx // ncols
        col = idx % ncols

        ax = axes[row][col]

        data_looking = data[data['description'] == 'called_strike']
        data_swinging = data[data['description'] == 'swinging_strike']

        ax.scatter(data_looking['plate_x'], data_looking['plate_z'], label='Looking', color='blue', marker='o')
        ax.scatter(data_swinging['plate_x'], data_swinging['plate_z'], label='Swinging', color='red', marker='x')

        x = [-0.88, 0.88, 0.88, -0.88, -0.88]
        y = [1.51, 1.51, 3.4, 3.4, 1.51]
        ax.fill(x, y, color='r', alpha=0.3)

        ax.set_title(pitch_type)
        ax.set_xlabel('Plate X')
        ax.set_ylabel('Plate Z')

        # Set limits for X and Y axes
        ax.set_xlim(-2, 2)
        ax.set_ylim(0, 5)

        ax.grid(which='both', linestyle='--', color='gray', alpha=0.5)
        ax.legend()

    plt.tight_layout()
    plt.suptitle(f'Strikeout Location in {year}', y=1.02)
    plt.show()

plot_strikeout_location_single_year(df_2019, 2019)
plot_strikeout_location_single_year(df_2020, 2020)
plot_strikeout_location_single_year(df_2021, 2021)
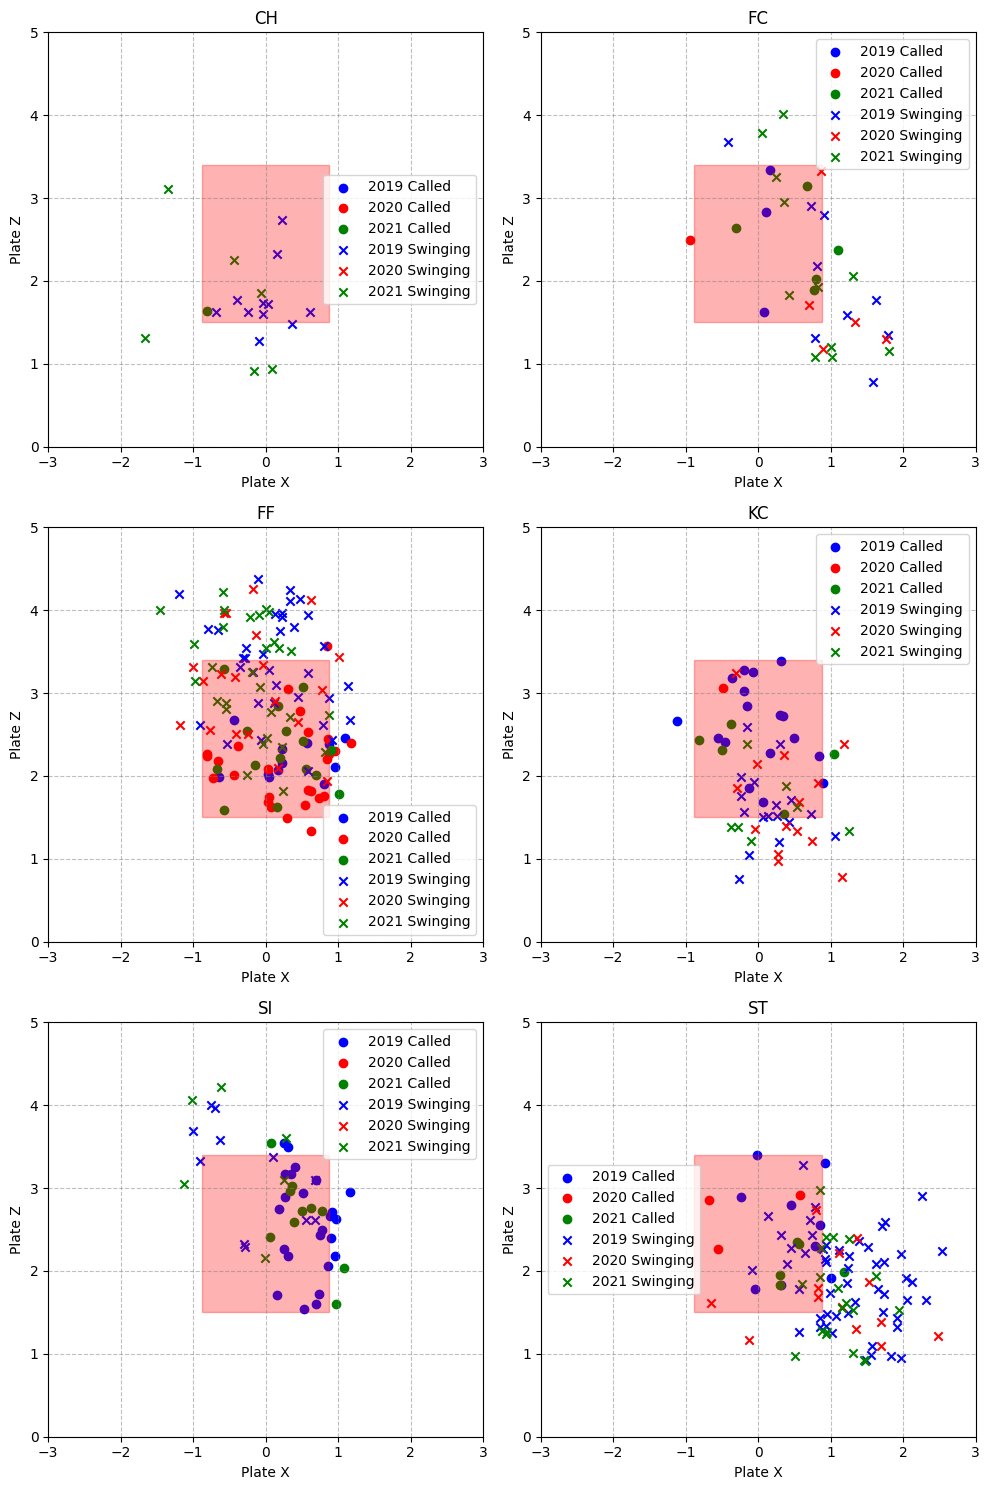
空振り三振、見逃し三振 コース (球種別、年別)
さらに年別にしています
ナックルカーブ、スライダー、スイーパーあたりの投球について、右打者から見てアウトコースに逃げる部分。ここが得意なんですね
def plot_strikeout_location_single_year(df, year):
    df_strikeouts = df[df['events'] == 'strikeout']
    grouped = df_strikeouts.groupby('pitch_type')

    nrows = 3
    ncols = 2
    titles = []

    fig, axes = plt.subplots(nrows=nrows, ncols=ncols, figsize=(10, 15))

    for idx, (pitch_type, data) in enumerate(grouped):
        titles.append(pitch_type)

        row = idx // ncols
        col = idx % ncols

        ax = axes[row][col]

        data_looking = data[data['description'] == 'called_strike']
        data_swinging = data[data['description'] == 'swinging_strike']

        ax.scatter(data_looking['plate_x'], data_looking['plate_z'], label='Looking', color='blue', marker='o')
        ax.scatter(data_swinging['plate_x'], data_swinging['plate_z'], label='Swinging', color='red', marker='x')

        x = [-0.88, 0.88, 0.88, -0.88, -0.88]
        y = [1.51, 1.51, 3.4, 3.4, 1.51]
        ax.fill(x, y, color='r', alpha=0.3)

        ax.set_title(pitch_type)
        ax.set_xlabel('Plate X')
        ax.set_ylabel('Plate Z')

        # Set limits for X and Y axes
        ax.set_xlim(-2, 2)
        ax.set_ylim(0, 5)

        ax.grid(which='both', linestyle='--', color='gray', alpha=0.5)
        ax.legend()

    plt.tight_layout()
    plt.suptitle(f'Strikeout Location in {year}', y=1.02)
    plt.show()

plot_strikeout_location_single_year(df_2019, 2019)
plot_strikeout_location_single_year(df_2020, 2020)
plot_strikeout_location_single_year(df_2021, 2021)
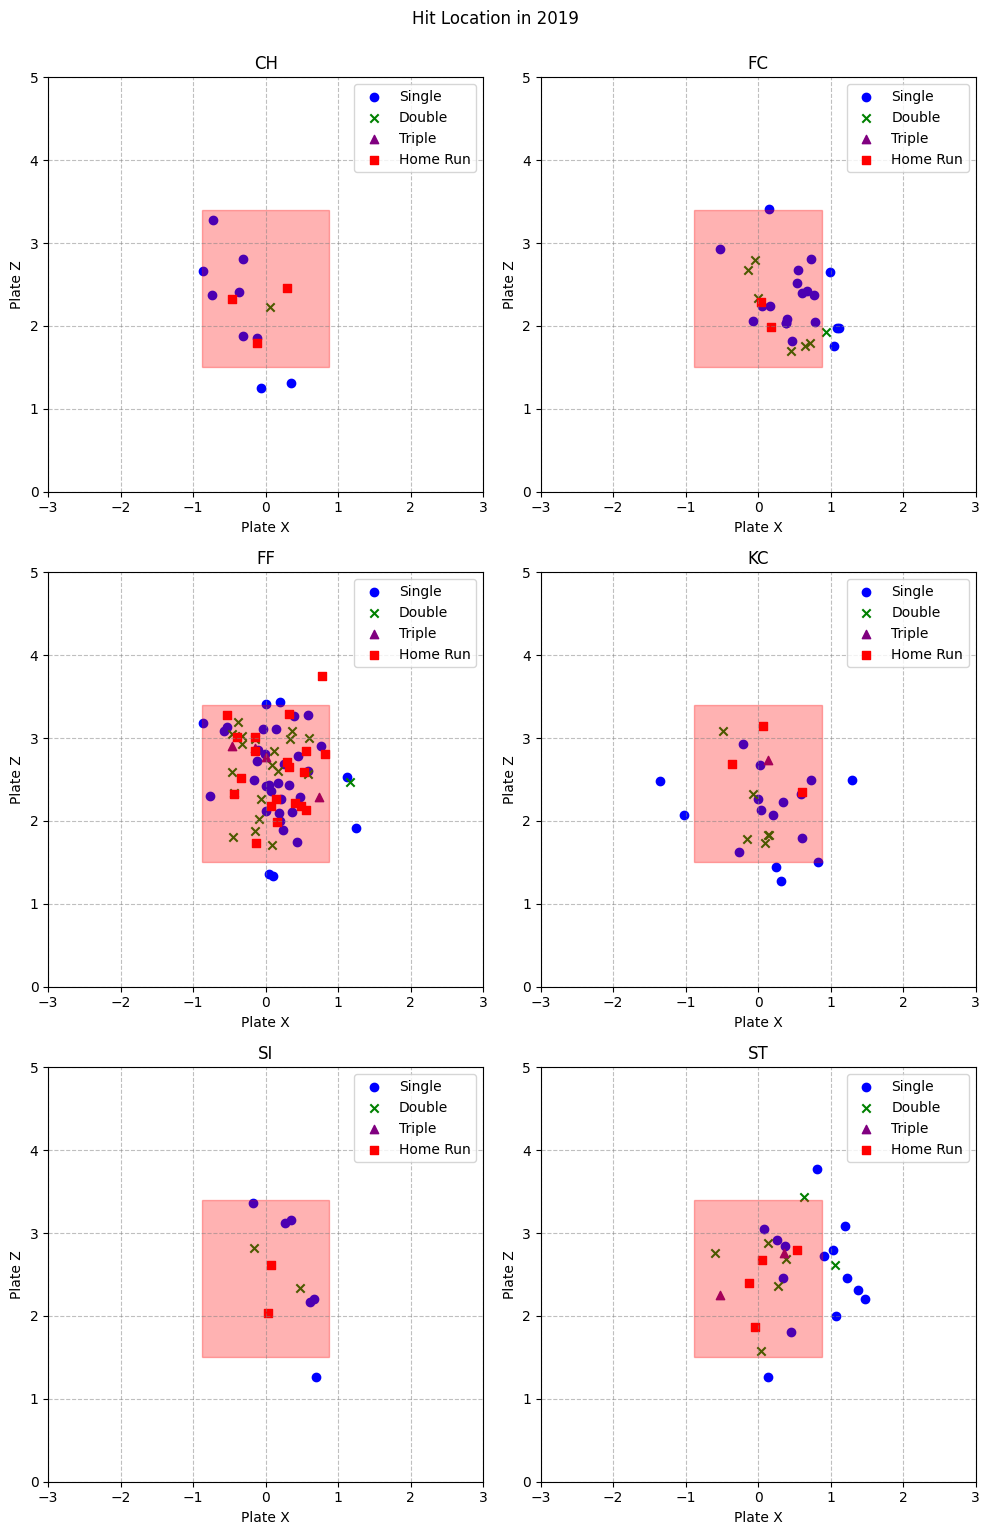
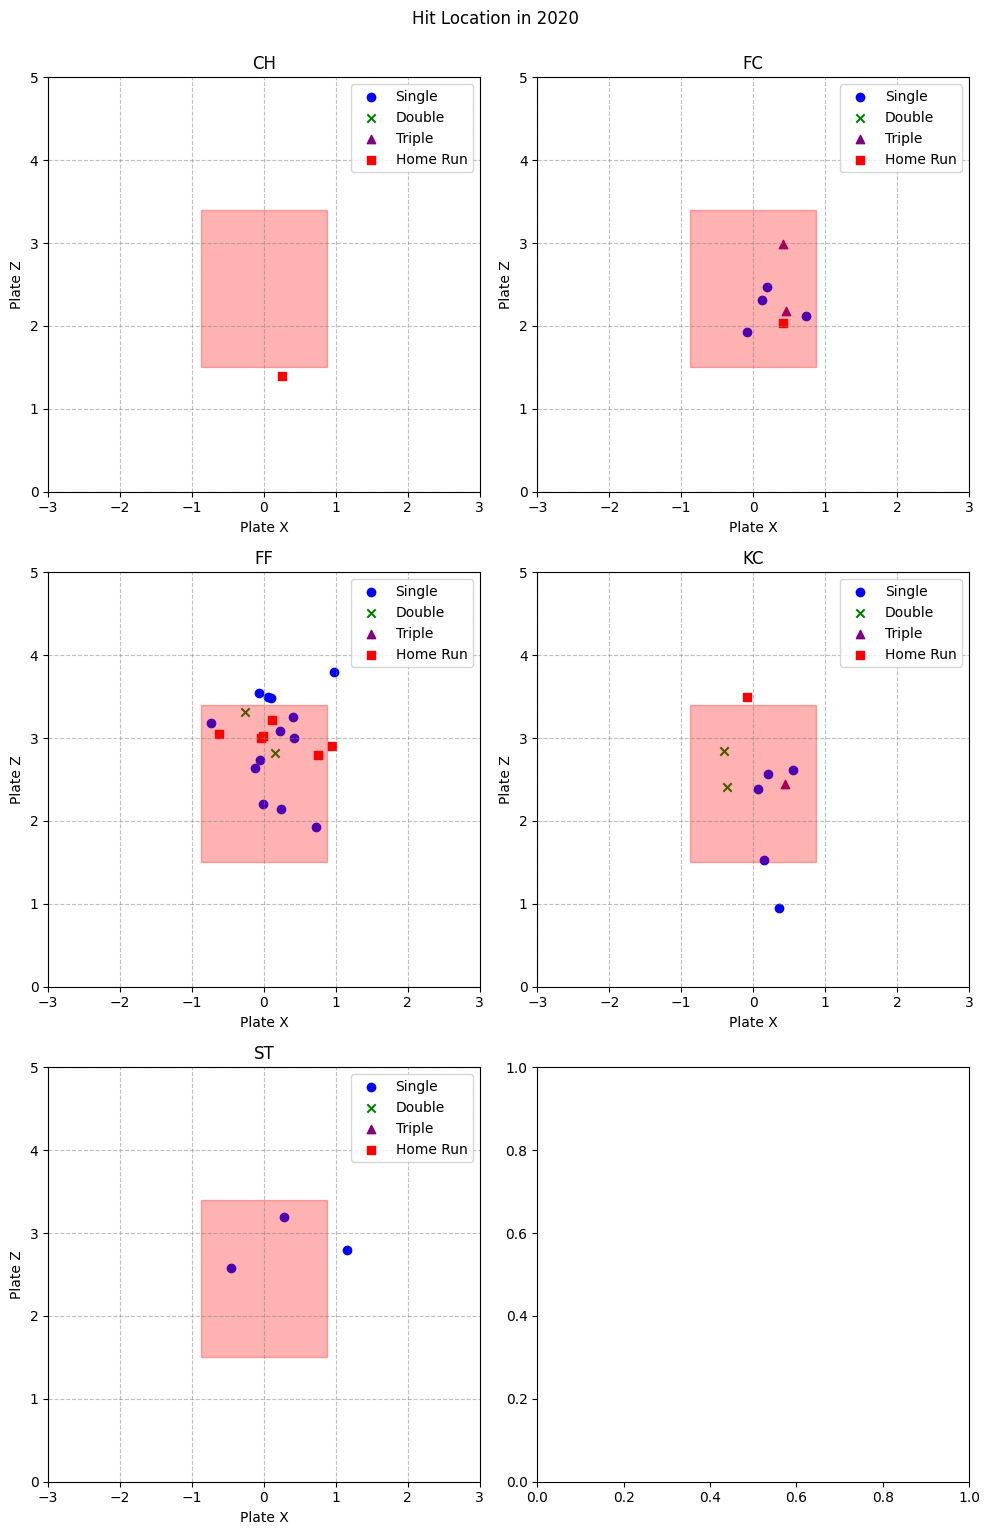
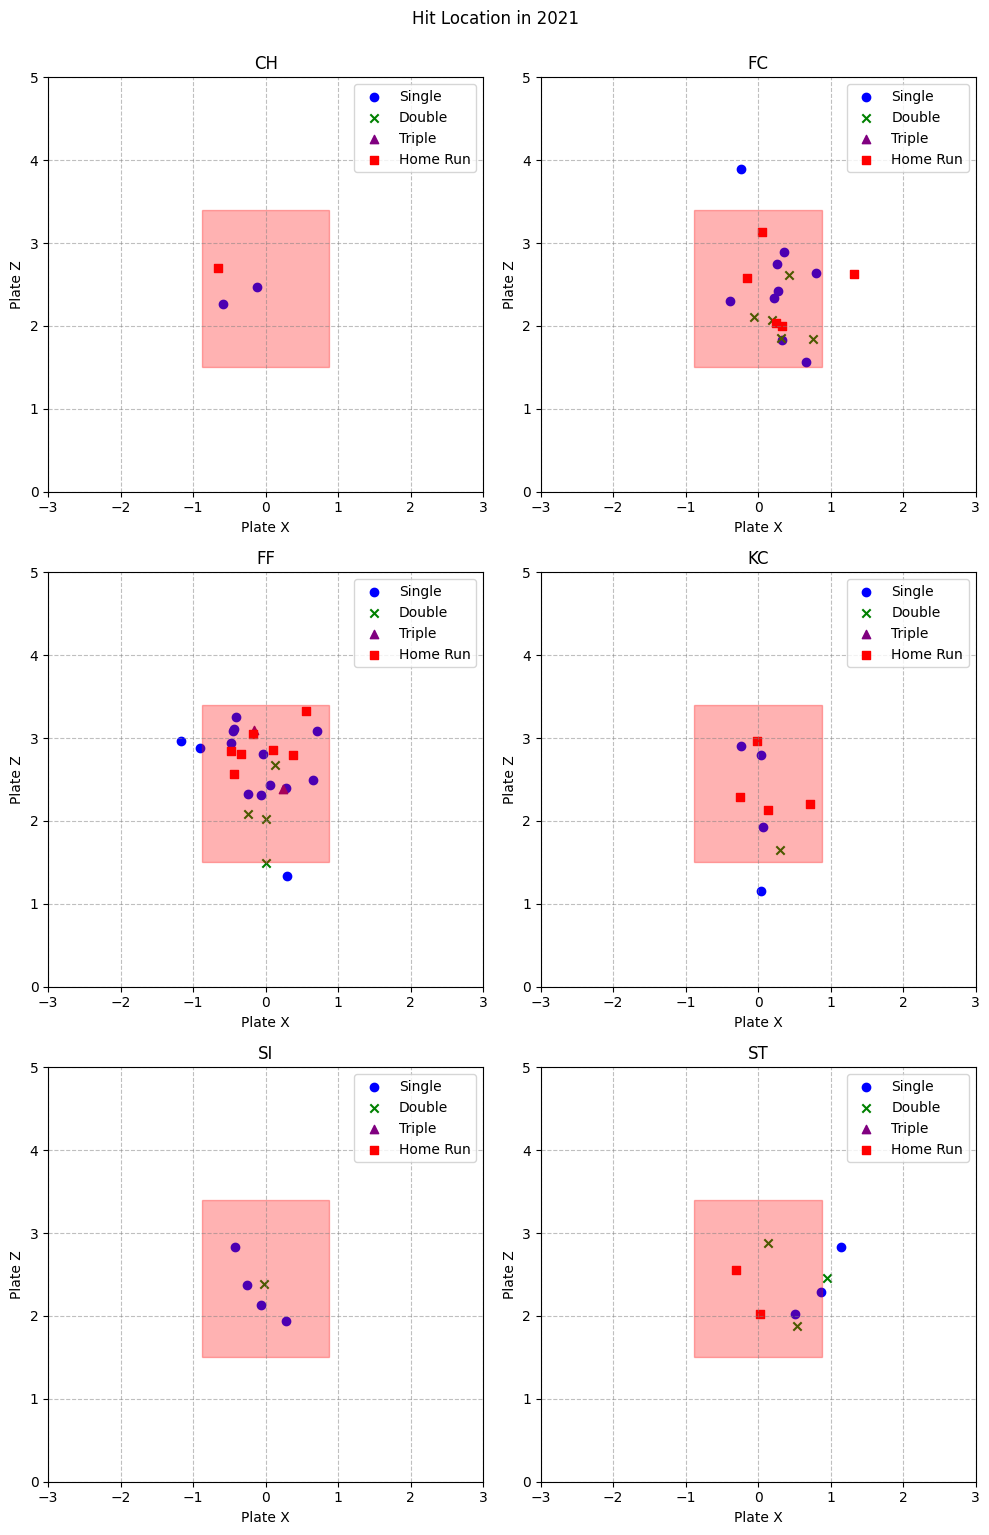
ヒットを打たれた コース (球種別、年別)
このコードは、バウアー選手の各年度(2019年、2020年、2021年)におけるヒット(single、double、triple、home_run)の投球位置を、球種別に散布図で表示します。
def plot_hit_location_single_year(df, year):
    # ヒット(ヒット、二塁打、三塁打、ホームラン)に関するデータのみ抽出
    hit_types = ['single', 'double', 'triple', 'home_run']
    df_hits = df[df['events'].isin(hit_types)]

    # データを pitch_type ごとにグループ分けする
    grouped = df_hits.groupby('pitch_type')

    # グラフの数と行列を指定
    nrows = 3
    ncols = 2

    # サブプロットのタイトル用に球種を格納
    titles = []

    fig, axes = plt.subplots(nrows=nrows, ncols=ncols, figsize=(10, 15))

    for idx, (pitch_type, data) in enumerate(grouped):
        # サブプロットのタイトルに球種を追加
        titles.append(pitch_type)

        # サブプロットに対応する行と列のインデックスを計算
        row = idx // ncols
        col = idx % ncols

        ax = axes[row][col]

        # ヒットの種類ごとにプロット
        data_single = data[data['events'] == 'single']
        data_double = data[data['events'] == 'double']
        data_triple = data[data['events'] == 'triple']
        data_home_run = data[data['events'] == 'home_run']

        ax.scatter(data_single['plate_x'], data_single['plate_z'], label='Single', color='blue', marker='o')
        ax.scatter(data_double['plate_x'], data_double['plate_z'], label='Double', color='green', marker='x')
        ax.scatter(data_triple['plate_x'], data_triple['plate_z'], label='Triple', color='purple', marker='^')
        ax.scatter(data_home_run['plate_x'], data_home_run['plate_z'], label='Home Run', color='red', marker='s')

        # ストライクゾーン
        x = [-0.88, 0.88, 0.88, -0.88, -0.88]
        y = [1.51, 1.51, 3.4, 3.4, 1.51]
        ax.fill(x, y, color='r', alpha=0.3)


        # Set X and Y axis limits
        ax.set_xlim(-3, 3)
        ax.set_ylim(0, 5)

        ax.set_title(pitch_type)
        ax.set_xlabel('Plate X')
        ax.set_ylabel('Plate Z')

        # 罫線
        ax.grid(which='both', linestyle='--', color='gray', alpha=0.5)

        # 凡例を表示する
        ax.legend()

    # グラフを表示する
    plt.tight_layout()
    plt.suptitle(f'Hit Location in {year}', y=1.02)
    plt.show()

# 各年のグラフをプロット
plot_hit_location_single_year(df_2019, 2019)
plot_hit_location_single_year(df_2020, 2020)
plot_hit_location_single_year(df_2021, 2021)
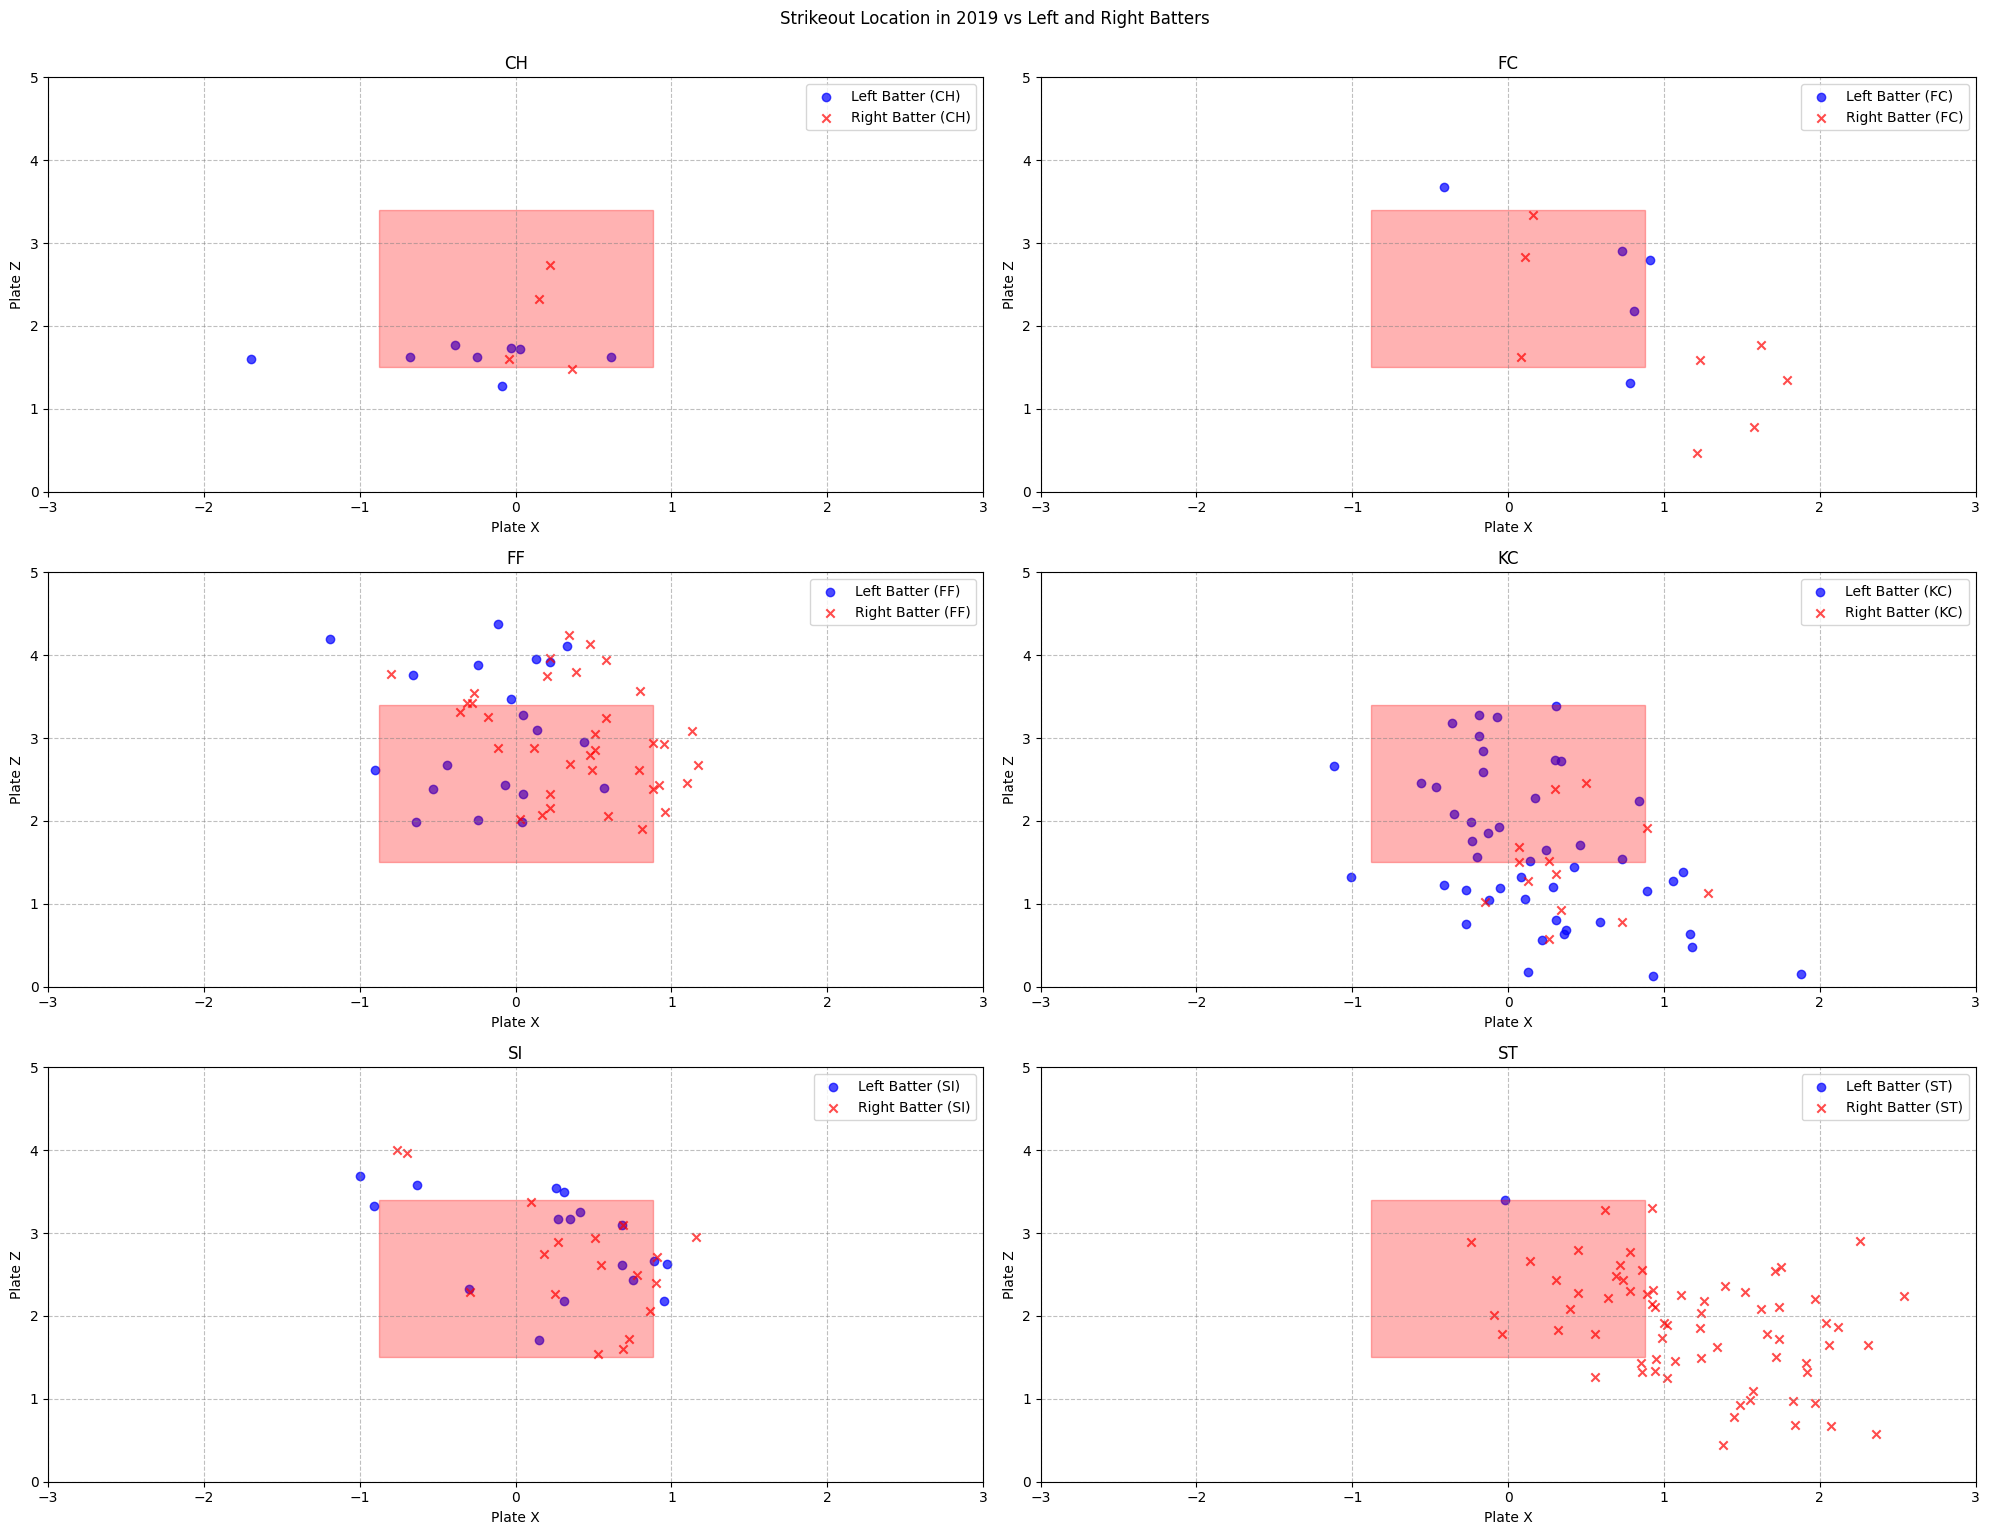
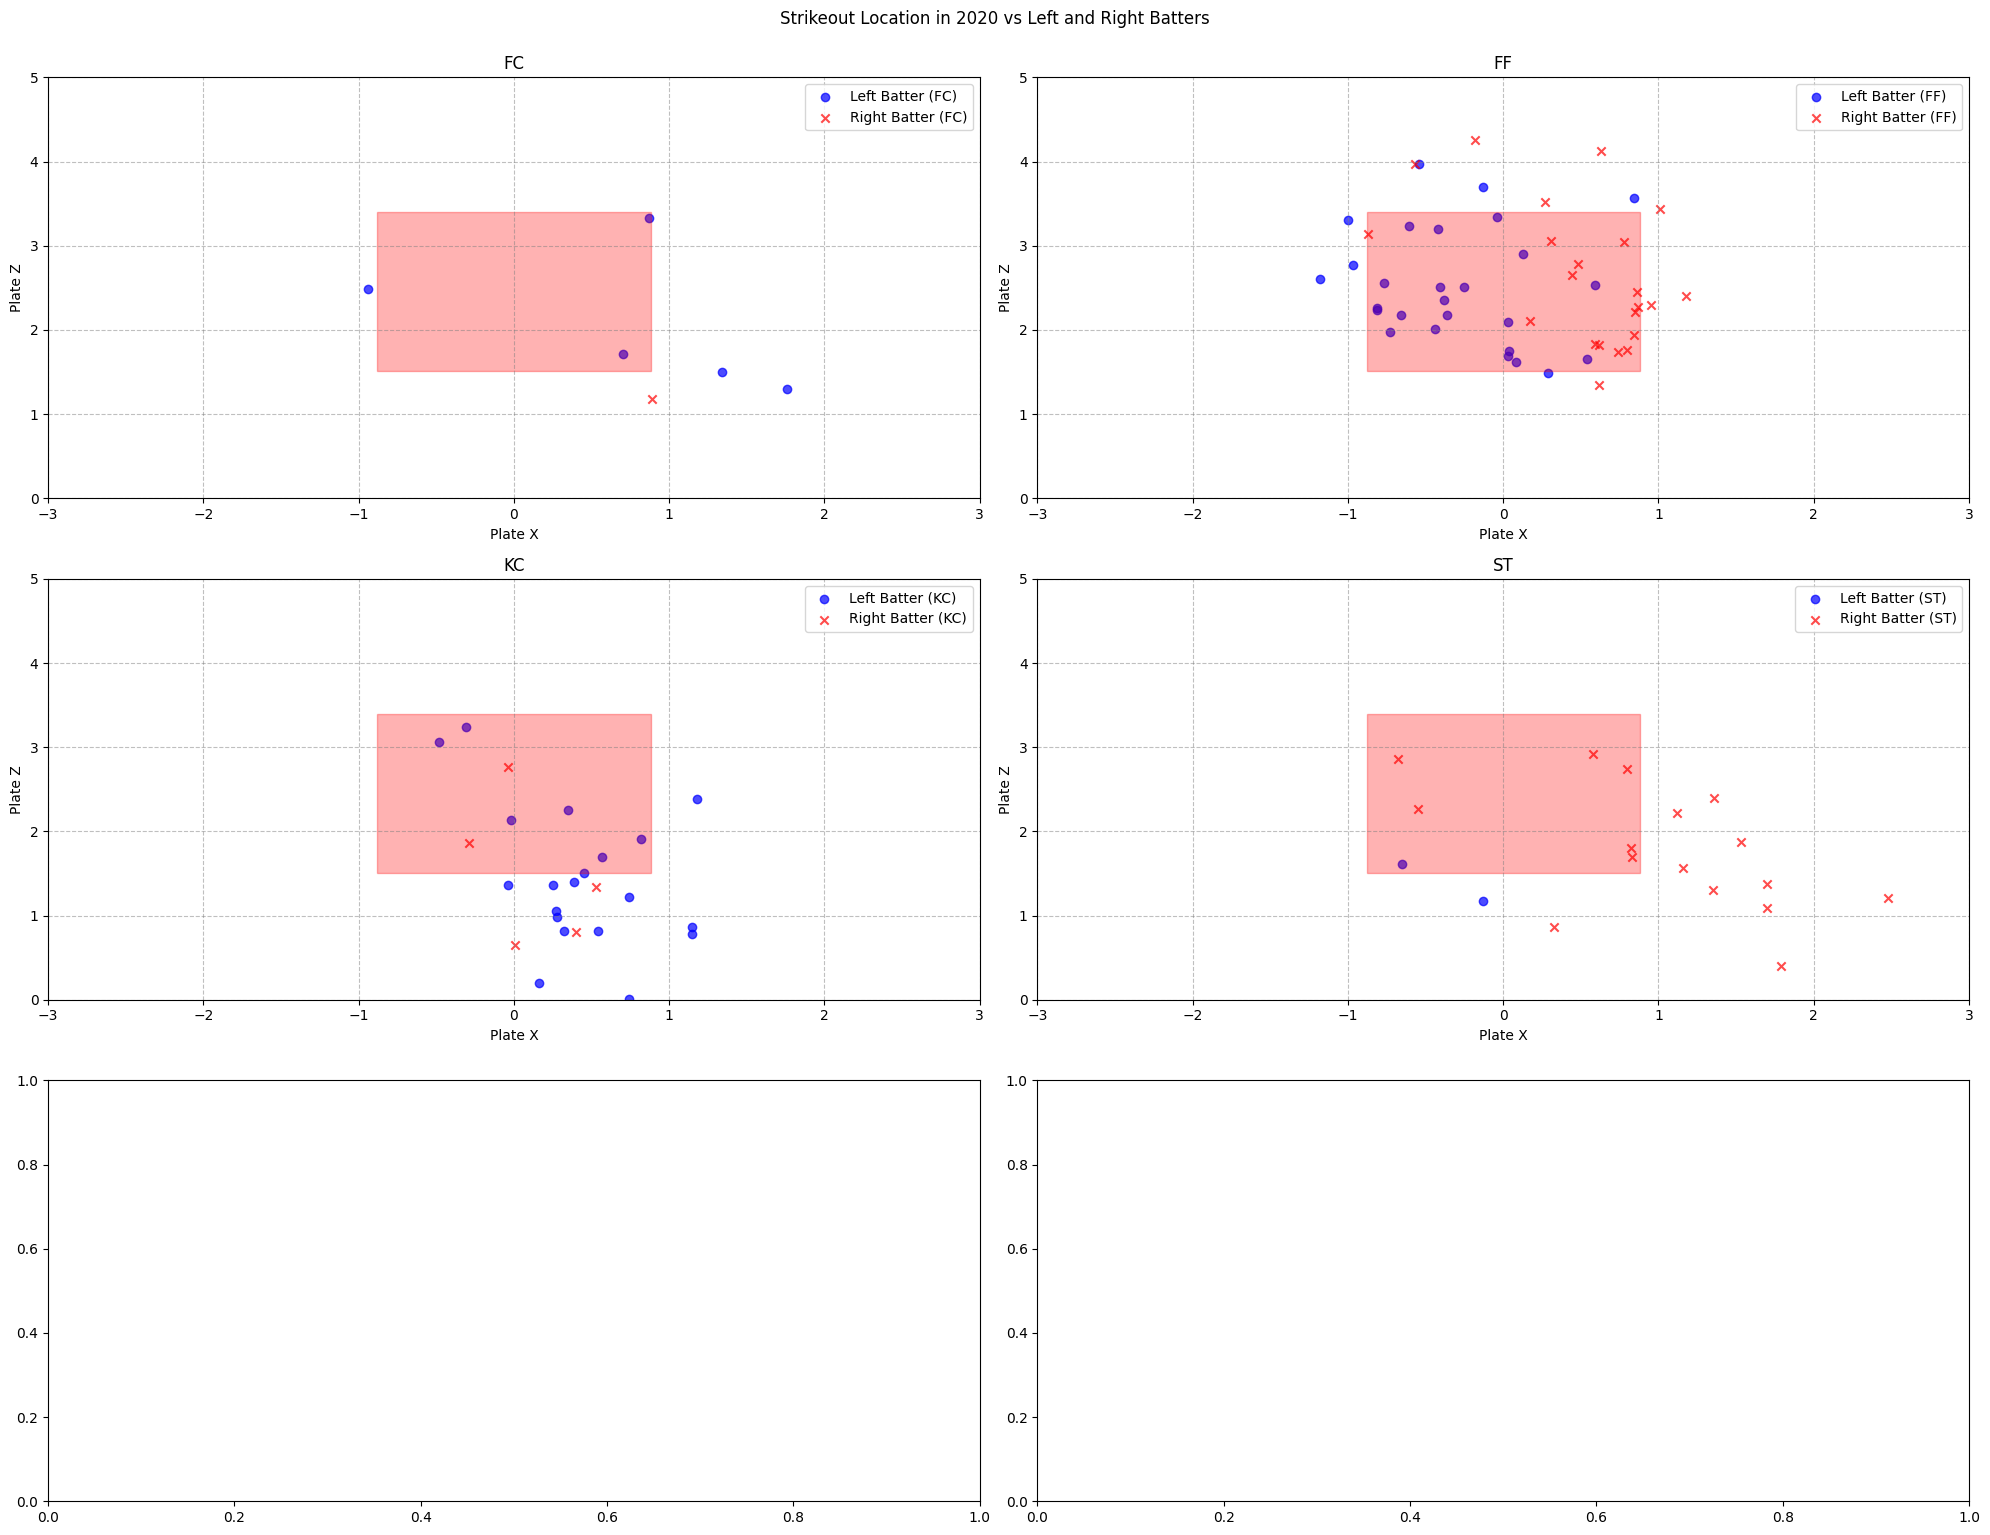
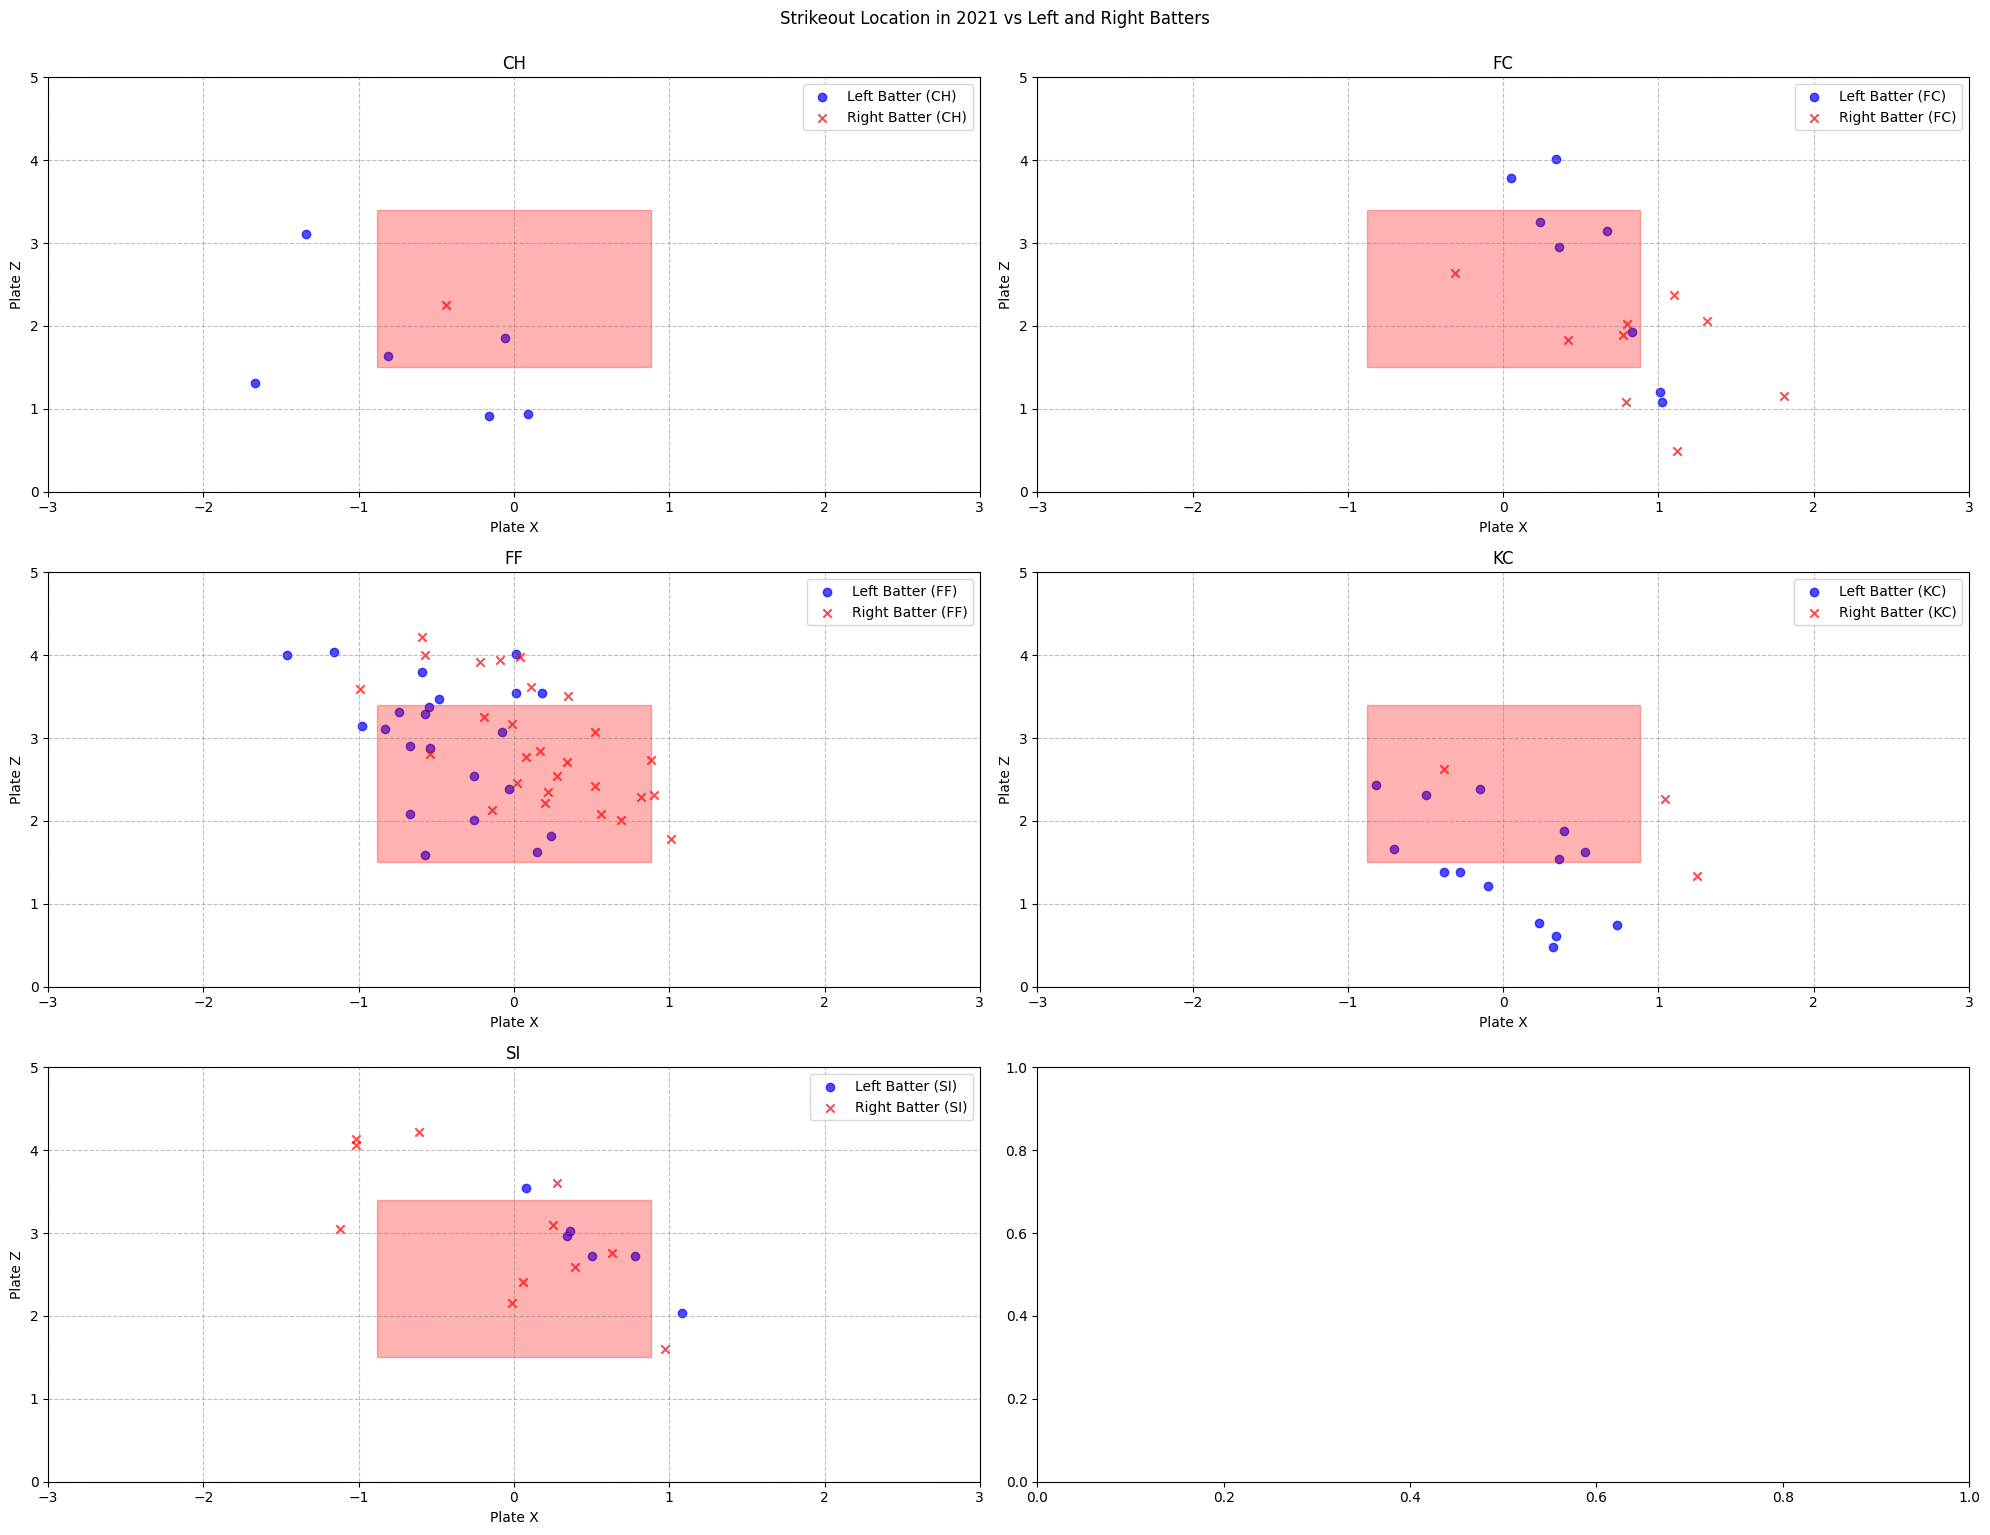
空振り三振、見逃し三振 vs左右 コース (球種別、年別)
このコードは、バウアー投手の各年度(2019年、2020年、2021年)におけるストライクアウトの投球位置を、左右打者別に散布図で表示します。各年度ごとに球種ごとに個別のグラフが表示されます。
- 右打者には、アウトコースに逃げる ナックルカーブ、スライダー、スイーパーあたりで三振を取りまくっている
- 左打者にもナックルカーブが効いているようだ
def plot_strikeout_location_single_year_vs_batters(df, year):
    # 三振に関するデータのみ抽出
    df_strikeouts = df[df['events'] == 'strikeout']

    # 左打者と右打者に対する投球データを抽出
    df_L = df_strikeouts[df_strikeouts['stand'] == 'L']
    df_R = df_strikeouts[df_strikeouts['stand'] == 'R']

    # データを pitch_type ごとにグループ分けする
    grouped_L = df_L.groupby('pitch_type')
    grouped_R = df_R.groupby('pitch_type')

    # グラフの数と行列を指定
    nrows = 3
    ncols = 2

    fig, axes = plt.subplots(nrows=nrows, ncols=ncols, figsize=(20, 15))

    for idx, (group_L, group_R) in enumerate(zip(grouped_L, grouped_R)):
        pitch_type, data_L = group_L
        _, data_R = group_R

        # サブプロットに対応する行と列のインデックスを計算
        row = idx // ncols
        col = idx % ncols

        ax = axes[row][col]

        # 左打者
        ax.scatter(data_L['plate_x'], data_L['plate_z'], label=f'Left Batter ({pitch_type})', color='blue', marker='o', alpha=0.7)
        # 右打者
        ax.scatter(data_R['plate_x'], data_R['plate_z'], label=f'Right Batter ({pitch_type})', color='red', marker='x', alpha=0.7)

        # ストライクゾーン
        x = [-0.88, 0.88, 0.88, -0.88, -0.88]
        y = [1.51, 1.51, 3.4, 3.4, 1.51]
        ax.fill(x, y, color='r', alpha=0.3)

        # Set X and Y axis limits
        ax.set_xlim(-3, 3)
        ax.set_ylim(0, 5)

        ax.set_title(pitch_type)
        ax.set_xlabel('Plate X')
        ax.set_ylabel('Plate Z')

        # 罫線
        ax.grid(which='both', linestyle='--', color='gray', alpha=0.5)

        # 凡例を表示する
        ax.legend()

    # グラフを表示する
    plt.tight_layout()
    plt.suptitle(f'Strikeout Location in {year} vs Left and Right Batters', y=1.02)
    plt.show()

# 各年のグラフをプロット
plot_strikeout_location_single_year_vs_batters(df_2019, 2019)
plot_strikeout_location_single_year_vs_batters(df_2020, 2020)
plot_strikeout_location_single_year_vs_batters(df_2021, 2021)
奪三振 vs左右 (年別)
このコードは、バウアーによって左打者と右打者のそれぞれが受けた三振の数を数える
def count_strikeouts(df):
    # 三振に関するデータのみ抽出
    df_strikeouts = df[df['events'] == 'strikeout']

    # 左打者と右打者に対する投球データを抽出
    df_L = df_strikeouts[df_strikeouts['stand'] == 'L']
    df_R = df_strikeouts[df_strikeouts['stand'] == 'R']

    # 三振数をカウント
    strikeouts_L = df_L.shape[0]
    strikeouts_R = df_R.shape[0]

    # 各種三振数をディクショナリに格納
    stats = {
        'Left Batters': {
            'Total Strikeouts': strikeouts_L
        },
        'Right Batters': {
            'Total Strikeouts': strikeouts_R
        }
    }

    return stats

# 各年のデータに対して三振数をカウント
stats_2019 = count_strikeouts(df_2019)
stats_2020 = count_strikeouts(df_2020)
stats_2021 = count_strikeouts(df_2021)

# 結果を表示
print("2019年の三振数:")
print(stats_2019)
print("\n2020年の三振数:")
print(stats_2020)
print("\n2021年の三振数:")
print(stats_2021)
結果
2019年の三振数:
{'Left Batters': {'Total Strikeouts': 101}, 'Right Batters': {'Total Strikeouts': 152}}

2020年の三振数:
{'Left Batters': {'Total Strikeouts': 55}, 'Right Batters': {'Total Strikeouts': 45}}

2021年の三振数:
{'Left Batters': {'Total Strikeouts': 58}, 'Right Batters': {'Total Strikeouts': 79}}
投げた試合数の確認
unique_game_dates_2019 = df_2019['game_date'].unique()
unique_game_dates_2020 = df_2020['game_date'].unique()
unique_game_dates_2021 = df_2021['game_date'].unique()

print("Number of games pitched by Bauer in 2019:", len(unique_game_dates_2019))
print("Number of games pitched by Bauer in 2020:", len(unique_game_dates_2020))
print("Number of games pitched by Bauer in 2021:", len(unique_game_dates_2021))
結果
Number of games pitched by Bauer in 2019: 34
Number of games pitched by Bauer in 2020: 11
Number of games pitched by Bauer in 2021: 17
年ごとの奪三振
strikeouts_2019 = df_2019[df_2019['events'] == 'strikeout'].shape[0]
strikeouts_2020 = df_2020[df_2020['events'] == 'strikeout'].shape[0]
strikeouts_2021 = df_2021[df_2021['events'] == 'strikeout'].shape[0]

print("Number of strikeouts in 2019:", strikeouts_2019)
print("Number of strikeouts in 2020:", strikeouts_2020)
print("Number of strikeouts in 2021:", strikeouts_2021)
結果
Number of strikeouts in 2019: 253
Number of strikeouts in 2020: 100
Number of strikeouts in 2021: 137
年ごとの対戦打者数
このコードは、与えられた年度(2019年、2020年、2021年)において、左打者と右打者のそれぞれが対戦した投手数をカウントしています。
def count_batters_faced_v2(df):
    df_first_pitches = df[df['pitch_number'] == 1]
    df_L = df_first_pitches[df_first_pitches['stand'] == 'L']
    df_R = df_first_pitches[df_first_pitches['stand'] == 'R']

    batters_faced_L = len(df_L)
    batters_faced_R = len(df_R)

    return {'Left Batters': batters_faced_L, 'Right Batters': batters_faced_R}

batters_faced_2019_v2 = count_batters_faced_v2(df_2019)
batters_faced_2020_v2 = count_batters_faced_v2(df_2020)
batters_faced_2021_v2 = count_batters_faced_v2(df_2021)

print("2019年の対戦した打者数(左、右):")
print(batters_faced_2019_v2)

print("\n2020年の対戦した打者数(左、右):")
print(batters_faced_2020_v2)

print("\n2021年の対戦した打者数(左、右):")
print(batters_faced_2021_v2)
2019年の対戦した打者数(左、右):
{'Left Batters': 420, 'Right Batters': 494}

2020年の対戦した打者数(左、右):
{'Left Batters': 145, 'Right Batters': 132}

2021年の対戦した打者数(左、右):
{'Left Batters': 211, 'Right Batters': 220}
各年度における左右打者に対する三振率
このコードは、バウアー投手の各年度における左右打者に対する三振率を計算し、パーセンテージで表示します。
左右でそこまで差はないようだ
def convert_to_percentage(decimal):
    return round(decimal * 100, 2)

years = [2019, 2020, 2021]
dfs = [df_2019, df_2020, df_2021]

for year, df in zip(years, dfs):
    # 左打者と右打者のデータを分ける
    df_R = df[df['stand'] == 'R']
    df_L = df[df['stand'] == 'L']

    # 三振率を計算
    strikeout_rate_R = len(df_R[df_R['events'] == 'strikeout']) / len(df_R)
    strikeout_rate_L = len(df_L[df_L['events'] == 'strikeout']) / len(df_L)

    # パーセンテージに変換
    strikeout_percent = {
        'Left Batters': convert_to_percentage(strikeout_rate_L),
        'Right Batters': convert_to_percentage(strikeout_rate_R)
    }

    print(f"{year}年の対戦打者数に対する三振数の割合 (%):")
    print(strikeout_percent)
    print()
結果
2019年の対戦打者数に対する三振数の割合 (%):
{'Left Batters': 5.96, 'Right Batters': 7.63}

2020年の対戦打者数に対する三振数の割合 (%):
{'Left Batters': 9.0, 'Right Batters': 8.12}

2021年の対戦打者数に対する三振数の割合 (%):
{'Left Batters': 6.65, 'Right Batters': 8.63}
右打者と左打者に対する被打率、被本塁打数
トレバー・バウアーについて、右打者と左打者に対する被打率、被本塁打数
右相手のほうが分がある
スライダー系が得意であるし、投手だし納得ではある
def calc_batting_average(df, exclude_events):
    total_at_bats = len(df[~df['events'].isin(exclude_events)].groupby(['game_date', 'at_bat_number']).size())
    total_hits = len(df[df['events'] == 'single']) + len(df[df['events'] == 'double']) + len(df[df['events'] == 'triple']) + len(df[df['events'] == 'home_run'])
    batting_average = total_hits / total_at_bats
    return batting_average

exclude_events = ['walk', 'hit_by_pitch', 'sac_fly', 'sac_bunt', 'sac_fly_double_play', 'sac_bunt_double_play', 'catcher_interf', 'wild_pitch', 'game_advisory', 'pickoff_3b', 'caught_stealing_3b', 'pickoff_caught_stealing_2b', 'caught_stealing_home', 'sac_fly_double_play', 'wild_pitch', 'pickoff_1b', 'pickoff_caught_stealing_home', 'pickoff_caught_stealing_3b', 'pickoff_2b', 'caught_stealing_2b', 'other_out']

# 左打者と右打者のデータを分ける
df_R = df_545333_all_dates[df_545333_all_dates['stand'] == 'R']
df_L = df_545333_all_dates[df_545333_all_dates['stand'] == 'L']

# 被打率を計算
ba_R = calc_batting_average(df_R, exclude_events)
ba_L = calc_batting_average(df_L, exclude_events)

print(f"対右打者 被打率: {ba_R:.3f}")
print(f"対左打者 被打率: {ba_L:.3f}")

# 右打者の被本塁打数
hr_count_R = len(df_R[df_R['events'] == 'home_run'])
print(f"\n対右打者 被本塁打数: {hr_count_R}")

# 左打者の被本塁打数
hr_count_L = len(df_L[df_L['events'] == 'home_run'])
print(f"対左打者 被本塁打数: {hr_count_L}")
結果
対右打者 被打率: 0.168
対左打者 被打率: 0.201

対右打者 被本塁打数: 22
対左打者 被本塁打数: 40
右打者と左打者に対する被打率、被本塁打数 (各年ごと)
# game_date列を文字列に変換
df_545333_all_dates['game_date'] = df_545333_all_dates['game_date'].astype(str)

# 各年のデータを分ける
df_2019 = df_545333_all_dates[df_545333_all_dates['game_date'].str.startswith('2019')]
df_2020 = df_545333_all_dates[df_545333_all_dates['game_date'].str.startswith('2020')]
df_2021 = df_545333_all_dates[df_545333_all_dates['game_date'].str.startswith('2021')]

# 以下のコードは変更ありません
years = [2019, 2020, 2021]
dfs = [df_2019, df_2020, df_2021]

for year, df in zip(years, dfs):
    # 左打者と右打者のデータを分ける
    df_R = df[df['stand'] == 'R']
    df_L = df[df['stand'] == 'L']

    # 被打率を計算
    ba_R = calc_batting_average(df_R, exclude_events)
    ba_L = calc_batting_average(df_L, exclude_events)

    print(f"{year}年 対右打者 被打率: {ba_R:.3f}")
    print(f"{year}年 対左打者 被打率: {ba_L:.3f}")

    # 右打者の被本塁打数
    hr_count_R = len(df_R[df_R['events'] == 'home_run'])
    print(f"{year}年 対右打者 被本塁打数: {hr_count_R}")

    # 左打者の被本塁打数
    hr_count_L = len(df_L[df_L['events'] == 'home_run'])
    print(f"{year}年 対左打者 被本塁打数: {hr_count_L}")
    print()
結果
2019年 対右打者 被打率: 0.192
2019年 対左打者 被打率: 0.216
2019年 対右打者 被本塁打数: 14
2019年 対左打者 被本塁打数: 20

2020年 対右打者 被打率: 0.136
2020年 対左打者 被打率: 0.159
2020年 対右打者 被本塁打数: 1
2020年 対左打者 被本塁打数: 8

2021年 対右打者 被打率: 0.132
2021年 対左打者 被打率: 0.199
2021年 対右打者 被本塁打数: 7
2021年 対左打者 被本塁打数: 12
ブランクがあるが、このあたりの投球が日本でどう変わっているか、注目である